The mathematics of a medical second opinion
The more threatening your diagnosis is, the more important it becomes to consult a second doctor. Here is the maths to prove it.
Certain recent events got me thinking about the importance of getting a second doctor’s opinion regarding any diagnosis. Since I have been researching Quantum de Finetti theorem, which is closely linked to classical Bayesian probability, it seems only natural to apply these ideas to medical diagnoses and see if we can get some sound advice: Is getting a medical second opinion good or will it muddy the waters? And, keep in mind, we are looking for a mathematically undeniable result here, not abstract poppycock.
(If you need a primer on Bayesian probability read the next section, else feel free to skip ahead to your first visit to the doctor.)
Basic ideas about probability
Unlike the frequentist approach to probability – which is what most people are familiar with – the Bayesian approach is more indicative of realistic expectation based on new knowledge about a system rather than completely reliant on repetitions and trials. It takes multiple factors into account before determining a probability, which turns out to mean that the probability of one of two things happening need no longer be half-and-half.
To better understand this, consider a coin being tossed: frequentist probability tells you that the likelihood of the coin landing on heads is 50% and likewise for tails. Two tosses later it is likely you have seemingly disproved the theory because you tossed two straight heads. But frequentist probability is pretty meaningless at this point: toss the same coin a million times and you will almost certainly end up with 500,000 heads and as many tails, give or take a dozen. There still is some uncertainty but it is greatly reduced.
Bayesian probability, on the other hand, uses extra data to make more accurate, realistic guesses. It is still probability at the end of the day but, if you have sufficient background data, it is far more accurate than the frequentist approach. This is both the downside of Bayesian probability and its advantage because if you have no extra data you gain nothing from Bayes’s work. The formula itself looks like this:
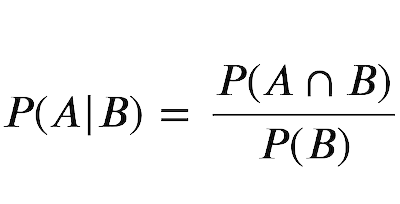
where A is the event in question and X is any additional data we have about it. To put it into perspective this is what a verbal translation of this formula might sound like:
The chance of an event A happening given that some data X is true is the product of the chance of X being true if that A did happen and the frequentist probability of A happening over a sum of this same product and its negation.
Specifically the negation is the chance of A happening if X was false times the frequentist probability of A being false. This might sound simple on the surface but can be a powerful idea when used properly. But, as one last observation before we look into medical diagnoses, consider you have no additional data: with X completely unknown the left-hand side of the equation above is simply frequentist probability since the denominator will reduce to the somewhat fruitless sum of the probability of a positive OR a negative result1, which is just one.
Your first visit to the doctor
We really need to talk about two things, broadly: visiting the doctor for a diagnosis on something terminal, like cancer, and for a diagnosis on something routine, like the flu. The simple reason behind this is the difference in the rarity of these two. (We will, as you shall soon see, end up with different results in both cases.) Things may get lachrymose for some people here onwards.
Say you visit your doctor to test for cancer and the doctor tells you that the test came out positive. This is sad news and you have probably already begun considering seeking a second opinion. In disbelief you ask the doctor if there is any chance the test could be a false positive and the doctor shakes his head: ‘There’s only a 10% chance that this test could be wrong’.
On your way back home, sitting at the back of a cab, you look up the rarity of the disease you might have: statistics show, say, that your particular type of cancer occurs in only 1% of all people on earth. ‘What are the chances’, you sigh. You read further that tests like the one you took have an 80% success rate when it comes to detecting cancer and the numbers only get gloomier.
Think logically and you will find that all is not lost. Look at the data you have:
- The chance of you not having cancer and the text being positive, i.e. P(X|not A), is 10% or, as a decimal, is 0.1.
- The chance of a human having this type of cancer, i.e. P(A), is 1% or, as a decimal, is 0.01.
- The chance of you having cancer and the test being positive, i.e. P(X|A), is 80% or, as a decimal, is 0.8.
- The chance of you not having this type of cancer, i.e. P(not A), is 99% or, as a decimal, is 0.99.
Substitute all this into our formula above: our numerator is 0.8 times 0.01 which is 0.008; the first term in our denominator is the same as the numerator and the second term is 0.1 times 0.99 which is 0.099. Our denominator therefore sums to 0.107 and our total fraction, i.e. the probability of you having cancer given your positive test result is 0.008/0.107 or a measly 7.5% chance. And you probably thought a test with 80% success rate implied you had an 80% chance of having cancer.
So the news is not all bad: before the test the likelihood of you having cancer—like the rest of humankind—was 1%, and now, following the positive test, it is 7.5% which is still a pretty low number and is nowhere near the 80% that that test had you believe was the case. Such is Bayesian probability.
Getting a second opinion
Next you visit another doctor who, perhaps, performs similar tests with similar known rates of success. Again, there are one of two pieces of news you can get: either this test too comes out positive or this one comes out negative. Let us start with the positive case and quickly go over the formula: our four terms are not P(A) is 7.5 based on your first test%; P(not A) is therefore 92.5% by simple subtraction 7.5% from 100%; P(X|not A) can be thought of as the same 10% since the test is the same; and P(X|A) too, similarly being dependent only on the test2 is still 80%.
Plug this into the formula and your chances of having cancer have naturally shot up to nearly 40%, meaning there is a 40% chance you might really have cancer after all.
What if the test came out negative, though? Then our variables look like this: P(X|not A) and P(X|A) are now reversed, i.e. they represent the chances of the test being positive if you do have cancer and if you do not respectively3; but P(A) and P(not A) do not flip around since the former is still your chance of having cancer and the latter is your chance of not having it. That is to say our numerator is now 10 times 7.5 and our denominator is a sum of 92.6 times 80 and 10 times 7.5. The probability that you do have cancer despite a negative test then promptly drops back to the original 1%.
This makes a lot of sense: if one test is positive and another negative you have learnt nothing new and are back at square one. And that is why a medical second opinion can be so important: if a doctor advices open heart surgery, a second doctor’s doubt could mean you have no problem at all. Moreover this is all not just verbal, mind you, this is pretty solid maths speaking.
What about the flu?
It is worth looking into whether the rarity of a disease contributes to the worthiness of a second opinion. At first glance it should since rarity features in our equation, but nothing is proven until we test things out a little. So let us assume you are running a moderate to high temperature and you go to the doctor who asks a couple of questions and records your temperature (the ‘test’) and declares that you have the flu.
Statistics from WebMD4 give you a 12% chance of having the flu. Given the commonness of this ailment and the relative ease with which it can be diagnosed it is safe to assume that your doctor’s ‘tests’ were somewhat more accurate than tests for cancer. Say they have a 90% chance of being correct positive identification and a slim 5% chance of a false positive5, meaning you have something else or this was all just a false alarm.
In this case our four values are as follows:
- The chance of you not having the flu and the text being positive, i.e. P(X|not A), is 5% or, as a decimal, is 0.05.
- The chance of you having the flu, i.e. P(A), is 12% or, as a decimal, is 0.12.
- The chance of you having the flu and the test being positive, i.e. P(X|A), is 90% or, as a decimal, is 0.9.
- The chance of you not having the flu, i.e. P(not A), is 88% or, as a decimal, is 0.88.
Bayes’s formula then gives us a whopping 71% chance that you have the flu, making a second consultation somewhat unnecessary given that the issue is not too threatening. A subsequent second test, if you did get one, will put you at a 0.7% risk which is, surprisingly, lower than even cancer; but a second positive test following your first 71% likelihood will mean you have a 94% chance of having the flu.
As a final remark it is worth noting that you will never quite get to 100% so long as there is a non-zero chance of a false positive and a non-zero chance of not having the flu (or, equivalently, cancer), so hunting for certainty is quite a waste of your time. Perhaps this is ample mathematical proof that medical science—and perhaps biology in turn—is an uncertain, inaccurate and imprecise field by nature.
The uppercase OR is logical addition, not the english word or. For those unaware it refers to binary addition: so 1 + 1 = 1 + 0 = 1 and only 0 + 0 yields a zero, i.e. either this OR that is true if at least one is (or both are) true but is false if both are false. ↩
In the second test case we have assumed that the second doctor too performs the same test so the reliability of the test is assumed to be the same, which is reasonable. ↩
Strictly, these represent the chance of a negative test if you do not have cancer and a positive test if you do but this is the same as what we said albeit fully inverted. ↩
If this were a paper I would have picked a more citable source but for a casual assessment WebMD will do. Note also that WebMD quotes a range of 5–20% as the likelihood of someone getting the flu in the US. Firstly, I have considered the average of this, i.e. 12%; secondly, I have assumed this to be representative of people all over the earth, which, especially for the average, is not all that unreasonable. ↩
The chance of a false positive is not 10% for a 90% chance of positive. There is a difference between being a negative test and being a false positive test and false positives can often be much higher than real positives. Look it up: this is called the false positive paradox. ↩